
Modern political science proceeds from the position on the relationship of all phenomena and processes in society. It is impossible to understand events and processes, predict and manage the phenomena of political life without studying the connections and dependencies that exist in the political sphere of society. One of the most common tasks of policy research is to study the relationship between some observable variables. Helps to solve this problem a whole class of statistical methods of analysis, combined common name"regression analysis" (or, as it is also called, "correlation-regression analysis"). However, if correlation analysis makes it possible to assess the strength of the relationship between two variables, then using regression analysis it is possible to determine the type of this relationship, to predict the dependence of the value of any variable on the value of another variable.
First, let's remember what a correlation is. Correlative called the most important special case of statistical relationship, which consists in the fact that equal values of one variable correspond to different average values another. With a change in the value of the attribute x, the average value of the attribute y naturally changes, while in each individual case the value of the attribute at(with different probabilities) can take on many different values.
The appearance of the term “correlation” in statistics (and political science attracts the achievement of statistics for solving its problems, which, therefore, is a discipline related to political science) is associated with the name of the English biologist and statistician Francis Galton, who proposed in the 19th century. theoretical basis correlation and regression analysis. The term "correlation" in science was known before. In particular, in paleontology back in the 18th century. it was applied by the French scientist Georges Cuvier. He introduced the so-called correlation law, with the help of which, according to the remains of animals found during excavations, it was possible to restore their appearance.
There is a well-known story associated with the name of this scientist and his law of correlation. So, on the days of a university holiday, students who decided to play a trick on a famous professor pulled a goat skin with horns and hooves over one student. He climbed into the window of Cuvier's bedroom and shouted: "I'll eat you." The professor woke up, looked at the silhouette and replied: “If you have horns and hooves, then you are a herbivore and cannot eat me. And for ignorance of the law of correlation you will get a deuce. He turned over and fell asleep. A joke is a joke, but in this example we are seeing a special case of using multiple correlation-regression analysis. Here the professor, based on the knowledge of the values of the two observed traits (the presence of horns and hooves), based on the law of correlation, derived the average value of the third trait (the class to which this animal belongs is a herbivore). In this case, we are not talking about the specific value of this variable (i.e., this animal could take various meanings on a nominal scale - it could be a goat, and a ram, and a bull ...).
Now let's move on to the term "regression". Strictly speaking, it is not connected with the meaning of those statistical tasks that are solved using this method. An explanation of the term can only be given on the basis of knowledge of the history of the development of methods for studying the relationships between features. One of the first examples of studies of this kind was the work of statisticians F. Galton and K. Pearson, who tried to find a pattern between the growth of fathers and their children according to two observable signs (where X- father's height and U- children's growth). In their study, they confirmed the initial hypothesis that, on average, tall fathers raise averagely tall children. The same principle applies to low fathers and children. However, if the scientists had stopped there, their works would never have been mentioned in textbooks on statistics. The researchers found another pattern within the already mentioned confirmed hypothesis. They proved that very tall fathers produce children that are tall on average, but not very different in height from children whose fathers, although above average, are not very different from average height. The same is true for fathers with very small stature (deviating from the average of the short group) - their children, on average, did not differ in height from peers whose fathers were simply short. They called the function that describes this regularity regression function. After this study, all equations describing similar functions and constructed in a similar way began to be called regression equations.
Regression analysis is one of the methods of multivariate statistical data analysis, combining a set of statistical techniques designed to study or model relationships between one dependent and several (or one) independent variables. The dependent variable, according to the tradition accepted in statistics, is called the response and is denoted as V The independent variables are called predictors and are denoted as x. During the course of the analysis, some variables will be weakly related to the response and will eventually be excluded from the analysis. The remaining variables associated with the dependent may also be called factors.
Regression analysis makes it possible to predict the values of one or more variables depending on another variable (for example, the propensity for unconventional political behavior depending on the level of education) or several variables. It is calculated on PC. To compile a regression equation that allows you to measure the degree of dependence of the controlled feature on the factor ones, it is necessary to involve professional mathematicians-programmers. Regression analysis can provide an invaluable service in building predictive models for the development of a political situation, assessing the causes of social tension, and in conducting theoretical experiments. Regression analysis is actively used to study the impact on the electoral behavior of citizens of a number of socio-demographic parameters: gender, age, profession, place of residence, nationality, level and nature of income.
In relation to regression analysis, the concepts independent And dependent variables. An independent variable is a variable that explains or causes a change in another variable. A dependent variable is a variable whose value is explained by the influence of the first variable. For example, in the presidential elections in 2004, the determining factors, i.e. independent variables were indicators such as stabilization of the financial situation of the population of the country, the level of popularity of candidates and the factor incumbency. In this case, the percentage of votes cast for candidates can be considered as a dependent variable. Similarly, in the pair of variables “age of the voter” and “level of electoral activity”, the first one is independent, the second one is dependent.
Regression analysis allows you to solve the following problems:
- 1) establish the very fact of the presence or absence of a statistically significant relationship between Ci x;
- 2) build the best (in the statistical sense) estimates of the regression function;
- 3) according to the given values X build a prediction for the unknown At
- 4) evaluate the specific weight of the influence of each factor X on At and, accordingly, exclude insignificant features from the model;
- 5) by identifying causal relationships between variables, partially manage the values of P by adjusting the values of explanatory variables x.
Regression analysis is associated with the need to select mutually independent variables that affect the value of the indicator under study, determine the form of the regression equation, and evaluate parameters using statistical methods processing of primary sociological data. This type of analysis is based on the idea of the form, direction and closeness (density) of the relationship. Distinguish steam room And multiple regression depending on the number of studied features. In practice, regression analysis is usually performed in conjunction with correlation analysis. Regression Equation describes a numerical relationship between quantities, expressed as a tendency for one variable to increase or decrease while another increases or decreases. At the same time, razl and h a yut l frost And non-linear regression. When describing political processes both variants of regression are equally detected.
Scatterplot for the distribution of interdependence of interest in political articles ( U) and education of respondents (X) is a linear regression (Fig. 30).
Rice. thirty.
Scatterplot for the distribution of the level of electoral activity ( U) and age of the respondent (A) (conditional example) is a non-linear regression (Fig. 31).

Rice. 31.
To describe the relationship of two features (A "and Y) in a paired regression model, use linear equation
![]()
where a, is a random value of the error of the equation with variation of features, i.e. deviation of the equation from "linearity".
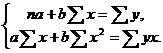
To evaluate the coefficients A And b use the least squares method, which assumes that the sum of the squared deviations of each point on the scatter plot from the regression line should be minimal. Odds a h b can be calculated using the system of equations: 
The method of least squares estimation gives such estimates of the coefficients A And b, for which the line passes through the point with coordinates X And y, those. there is a ratio at = ax + b. The graphical representation of the regression equation is called theoretical regression line. At linear dependence the regression coefficient represents on the graph the tangent of the slope of the theoretical regression line to the x-axis. The sign at the coefficient shows the direction of the connection. If it is greater than zero, then the relationship is direct; if it is less, it is inverse.
The following example from the study "Political Petersburg-2006" (Table 56) shows a linear relationship between citizens' perceptions of the degree of satisfaction with their lives in the present and expectations of changes in the quality of life in the future. The connection is direct, linear (the standardized regression coefficient is 0.233, the significance level is 0.000). In this case, the regression coefficient is not high, but it exceeds the lower limit of the statistically significant indicator (the lower limit of the square of the statistically significant indicator of the Pearson coefficient).
Table 56
The impact of the quality of life of citizens in the present on expectations
(St. Petersburg, 2006)
* Dependent variable: "How do you think your life will change in the next 2-3 years?"
In political life, the value of the variable under study most often simultaneously depends on several features. For example, the level and nature of political activity are simultaneously influenced by the political regime of the state, political traditions, the peculiarities of the political behavior of people in a given area and the social microgroup of the respondent, his age, education, income level, political orientation, etc. In this case, you need to use the equation multiple regression, which has the following form:
where coefficient b.- partial regression coefficient. It shows the contribution of each independent variable to determining the values of the independent (outcome) variable. If the partial regression coefficient is close to 0, then we can conclude that there is no direct relationship between the independent and dependent variables.
The calculation of such a model can be performed on a PC using matrix algebra. Multiple regression allows you to reflect the multifactorial nature of social ties and clarify the degree of influence of each factor individually and all together on the resulting trait.
Coefficient denoted b, called the linear regression coefficient and shows the strength of the relationship between the variation factor sign X and variation of the effective feature Y This coefficient measures the strength of the relationship in absolute units of measurement of features. However, the closeness of the correlation of features can also be expressed in terms of the standard deviation of the resulting feature (such a coefficient is called the correlation coefficient). Unlike the regression coefficient b the correlation coefficient does not depend on the accepted units of measurement of features, and therefore, it is comparable for any features. Usually, the connection is considered strong if /> 0.7, medium tightness - at 0.5 g 0.5.
As you know, the closest connection is a functional connection, when each individual value Y can be uniquely assigned to the value x. Thus, the closer the correlation coefficient is to 1, the closer the relationship is to a functional one. The significance level for regression analysis should not exceed 0.001.
The correlation coefficient has long been considered as the main indicator of the closeness of the relationship of features. However, later the coefficient of determination became such an indicator. The meaning of this coefficient is as follows - it reflects the share of the total variance of the resulting feature At, explained by the variance of the feature x. It is found by simply squaring the correlation coefficient (changing from 0 to 1) and, in turn, for a linear relationship reflects the share from 0 (0%) to 1 (100%) characteristic values Y, determined by the values of the attribute x. It is recorded as I 2 , and in the resulting tables of regression analysis in the SPSS package - without a square.
Let us denote the main problems of constructing the multiple regression equation.
- 1. Choice of factors included in the regression equation. At this stage, the researcher first compiles a general list of the main causes that, according to the theory, determine the phenomenon under study. Then he must select the features in the regression equation. The main selection rule is that the factors included in the analysis should correlate as little as possible with each other; only in this case it is possible to attribute a quantitative measure of influence to a certain factor-attribute.
- 2. Selecting the Form of the Multiple Regression Equation(in practice, linear or linear-logarithmic is more often used). So, to use multiple regression, the researcher must first build a hypothetical model of the influence of several independent variables on the resulting one. For the obtained results to be reliable, it is necessary that the model exactly matches the real process, i.e. the relationship between the variables must be linear, not a single significant independent variable can be ignored, in the same way, not a single variable that is not directly related to the process under study can be included in the analysis. In addition, all measurements of variables must be extremely accurate.
From the above description follows a number of conditions for the application of this method, without which it is impossible to proceed to the procedure of multiple regression analysis (MRA). Only compliance with all of the following points allows you to correctly carry out regression analysis.
The main goal of regression analysis consists in determining the analytical form of the relationship, in which the change in the resultant attribute is due to the influence of one or more factor signs, and the set of all other factors that also affect the resultant attribute is taken as constant and average values.Tasks of regression analysis:
a) Establishing the form of dependence. Regarding the nature and form of the relationship between phenomena, there are positive linear and non-linear and negative linear and non-linear regression.
b) Definition of the regression function in the form of a mathematical equation of one type or another and establishing the influence of explanatory variables on the dependent variable.
c) Evaluation unknown values dependent variable. Using the regression function, you can reproduce the values of the dependent variable within the interval of given values of the explanatory variables (i.e., solve the interpolation problem) or evaluate the course of the process outside the specified interval (i.e., solve the extrapolation problem). The result is an estimate of the value of the dependent variable.
Pair regression - the equation of the relationship of two variables y and x: y=f(x), where y is the dependent variable (resultant sign); x - independent, explanatory variable (feature-factor).
There are linear and non-linear regressions.
Linear regression: y = a + bx + ε
Nonlinear regressions are divided into two classes: regressions that are non-linear with respect to the explanatory variables included in the analysis, but linear with respect to the estimated parameters, and regressions that are non-linear with respect to the estimated parameters.
Regressions that are non-linear in explanatory variables:
Regressions that are non-linear in the estimated parameters:
- power y=a x b ε
- exponential y=a b x ε
- exponential y=e a+b x ε
For linear and nonlinear equations reducible to linear, the following system is solved for a and b:
You can use ready-made formulas that follow from this system:
The closeness of the connection between the studied phenomena is estimated by the linear pair correlation coefficient r xy for linear regression (-1≤r xy ≤1):

and correlation index p xy - for non-linear regression (0≤p xy ≤1):

An assessment of the quality of the constructed model will be given by the coefficient (index) of determination, as well as the average approximation error.
The average approximation error is the average deviation of the calculated values from the actual ones:
Permissible limit of values A - no more than 8-10%.
The average coefficient of elasticity E shows how many percent, on average, the result y will change from its average value on average when the factor x changes by 1% from its average value:
.
The task of analysis of variance is to analyze the variance of the dependent variable:
∑(y-y )²=∑(y x -y )²+∑(y-y x)²
where ∑(y-y)² is the total sum of squared deviations;
∑(y x -y)² - sum of squared deviations due to regression ("explained" or "factorial");
∑(y-y x)² - residual sum of squared deviations.
The share of the variance explained by regression in the total variance of the effective feature y is characterized by the coefficient (index) of determination R2: 
The coefficient of determination is the square of the coefficient or correlation index.
F-test - evaluation of the quality of the regression equation - consists in testing the hypothesis But about the statistical insignificance of the regression equation and the indicator of closeness of connection. For this, a comparison of the actual F fact and the critical (tabular) F table of the values of the Fisher F-criterion is performed. F fact is determined from the ratio of the values of the factorial and residual variances calculated for one degree of freedom:  ,
,
where n is the number of population units; m is the number of parameters for variables x.
F table is the maximum possible value of the criterion under the influence of random factors for given degrees of freedom and significance level a. Significance level a - the probability of rejecting the correct hypothesis, provided that it is true. Usually a is taken equal to 0.05 or 0.01.
If F table< F факт, то Н о - гипотеза о случайной природе оцениваемых характеристик отклоняется и признается их статистическая значимость и надежность. Если F табл >F is a fact, then the hypothesis H about is not rejected and the statistical insignificance, the unreliability of the regression equation is recognized.
To assess the statistical significance of the regression and correlation coefficients, Student's t-test and confidence intervals for each of the indicators are calculated. A hypothesis H about the random nature of the indicators is put forward, i.e. about their insignificant difference from zero. The assessment of the significance of the regression and correlation coefficients using the Student's t-test is carried out by comparing their values with the magnitude of the random error:
; ; .
Random errors of linear regression parameters and correlation coefficient are determined by the formulas: 
Comparing the actual and critical (tabular) values of t-statistics - t tabl and t fact - we accept or reject the hypothesis H o.
The relationship between Fisher's F-test and Student's t-statistics is expressed by the equality
If t table< t факт то H o отклоняется, т.е. a , b и r xy не случайно отличаются от нуля и сформировались под влиянием систематически действующего фактора х. Если t табл >t the fact that the hypothesis H about is not rejected and the random nature of the formation of a, b or r xy is recognized.
To calculate the confidence interval, we determine the marginal error D for each indicator:
Δ a =t table m a , Δ b =t table m b .
The formulas for calculating confidence intervals are as follows:
γ a \u003d aΔ a; γ a \u003d a-Δ a; γ a =a+Δa
γ b = bΔ b ; γ b = b-Δ b ; γb =b+Δb
If zero falls within the boundaries of the confidence interval, i.e. If the lower limit is negative and the upper limit is positive, then the estimated parameter is assumed to be zero, since it cannot simultaneously take on both positive and negative values.
The forecast value y p is determined by substituting the corresponding (forecast) value x p into the regression equation y x =a+b·x . The average standard error of the forecast m y x is calculated: 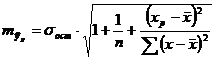 ,
,
Where 
and is being built confidence interval forecast:
γ y x =y p Δ y p ; γ y x min=y p -Δ y p ; γ y x max=y p +Δ y p
where Δ y x =t table ·m y x .
Solution Example
Task number 1. For seven territories of the Ural region For 199X, the values of two signs are known.Table 1.
Required: 1. To characterize the dependence of y on x, calculate the parameters of the following functions:
a) linear;
b) power law (previously it is necessary to perform the procedure of linearization of variables by taking the logarithm of both parts);
c) demonstrative;
d) equilateral hyperbola (you also need to figure out how to pre-linearize this model).
2. Evaluate each model through the average approximation error A and Fisher's F-test.
Solution (Option #1)
To calculate the parameters a and b of the linear regression y=a+b·x (the calculation can be done using a calculator).solve the system of normal equations with respect to A And b:
Based on the initial data, we calculate ∑y, ∑x, ∑y x, ∑x², ∑y²:
| y | x | yx | x2 | y2 | y x | y-y x | A i | |
| l | 68,8 | 45,1 | 3102,88 | 2034,01 | 4733,44 | 61,3 | 7,5 | 10,9 |
| 2 | 61,2 | 59,0 | 3610,80 | 3481,00 | 3745,44 | 56,5 | 4,7 | 7,7 |
| 3 | 59,9 | 57,2 | 3426,28 | 3271,84 | 3588,01 | 57,1 | 2,8 | 4,7 |
| 4 | 56,7 | 61,8 | 3504,06 | 3819,24 | 3214,89 | 55,5 | 1,2 | 2,1 |
| 5 | 55,0 | 58,8 | 3234,00 | 3457,44 | 3025,00 | 56,5 | -1,5 | 2,7 |
| 6 | 54,3 | 47,2 | 2562,96 | 2227,84 | 2948,49 | 60,5 | -6,2 | 11,4 |
| 7 | 49,3 | 55,2 | 2721,36 | 3047,04 | 2430,49 | 57,8 | -8,5 | 17,2 |
| Total | 405,2 | 384,3 | 22162,34 | 21338,41 | 23685,76 | 405,2 | 0,0 | 56,7 |
| Wed value (Total/n) | 57,89 y | 54,90 x | 3166,05 x y | 3048,34 x² | 3383,68 y² | X | X | 8,1 |
| s | 5,74 | 5,86 | X | X | X | X | X | X |
| s2 | 32,92 | 34,34 | X | X | X | X | X | X |

a=y -b x = 57.89+0.35 54.9 ≈ 76.88
Regression equation: y= 76,88 - 0,35X. With an increase in the average daily wages for 1 rub. the share of spending on the purchase of food products is reduced by an average of 0.35% points.
Calculate the linear coefficient of pair correlation: ![]()
Communication is moderate, reverse.
Let's determine the coefficient of determination: r² xy =(-0.35)=0.127
The 12.7% variation in the result is explained by the variation in the x factor. Substituting the actual values into the regression equation X, we determine the theoretical (calculated) values of y x . Let us find the value of the average approximation error A :
On average, the calculated values deviate from the actual ones by 8.1%.
Let's calculate the F-criterion: 
The obtained value indicates the need to accept the hypothesis H 0 about the random nature of the revealed dependence and the statistical insignificance of the parameters of the equation and the indicator of the tightness of the connection.
1b. The construction of the power model y=a x b is preceded by the procedure of linearization of variables. In the example, linearization is done by taking the logarithm of both sides of the equation:
lg y=lg a + b lg x
Y=C+b Y
where Y=lg(y), X=lg(x), C=lg(a).
For calculations, we use the data in Table. 1.3.
Table 1.3
| Y | X | YX | Y2 | x2 | y x | y-y x | (y-yx)² | A i | |
| 1 | 1,8376 | 1,6542 | 3,0398 | 3,3768 | 2,7364 | 61,0 | 7,8 | 60,8 | 11,3 |
| 2 | 1,7868 | 1,7709 | 3,1642 | 3,1927 | 3,1361 | 56,3 | 4,9 | 24,0 | 8,0 |
| 3 | 1,7774 | 1,7574 | 3,1236 | 3,1592 | 3,0885 | 56,8 | 3,1 | 9,6 | 5,2 |
| 4 | 1,7536 | 1,7910 | 3,1407 | 3,0751 | 3,2077 | 55,5 | 1,2 | 1,4 | 2,1 |
| 5 | 1,7404 | 1,7694 | 3,0795 | 3,0290 | 3,1308 | 56,3 | -1,3 | 1,7 | 2,4 |
| 6 | 1,7348 | 1,6739 | 2,9039 | 3,0095 | 2,8019 | 60,2 | -5,9 | 34,8 | 10,9 |
| 7 | 1,6928 | 1,7419 | 2,9487 | 2,8656 | 3,0342 | 57,4 | -8,1 | 65,6 | 16,4 |
| Total | 12,3234 | 12,1587 | 21,4003 | 21,7078 | 21,1355 | 403,5 | 1,7 | 197,9 | 56,3 |
| Average value | 1,7605 | 1,7370 | 3,0572 | 3,1011 | 3,0194 | X | X | 28,27 | 8,0 |
| σ | 0,0425 | 0,0484 | X | X | X | X | X | X | X |
| σ2 | 0,0018 | 0,0023 | X | X | X | X | X | X | X |
Calculate C and b:
C=Y -b X = 1.7605+0.298 1.7370 = 2.278126
We get a linear equation: Y=2.278-0.298 X
After potentiating it, we get: y=10 2.278 x -0.298
Substituting in this equation the actual values X, we get the theoretical values of the result. Based on them, we calculate the indicators: the tightness of the connection - the correlation index p xy and the average approximation error A . 
The characteristics of the power model indicate that it describes the relationship somewhat better than the linear function.
1c. The construction of the equation of the exponential curve y \u003d a b x is preceded by the procedure for linearizing the variables when taking the logarithm of both parts of the equation:
lg y=lg a + x lg b
Y=C+B x
For calculations, we use the table data.
| Y | x | Yx | Y2 | x2 | y x | y-y x | (y-yx)² | A i | |
| 1 | 1,8376 | 45,1 | 82,8758 | 3,3768 | 2034,01 | 60,7 | 8,1 | 65,61 | 11,8 |
| 2 | 1,7868 | 59,0 | 105,4212 | 3,1927 | 3481,00 | 56,4 | 4,8 | 23,04 | 7,8 |
| 3 | 1,7774 | 57,2 | 101,6673 | 3,1592 | 3271,84 | 56,9 | 3,0 | 9,00 | 5,0 |
| 4 | 1,7536 | 61,8 | 108,3725 | 3,0751 | 3819,24 | 55,5 | 1,2 | 1,44 | 2,1 |
| 5 | 1,7404 | 58,8 | 102,3355 | 3,0290 | 3457,44 | 56,4 | -1,4 | 1,96 | 2,5 |
| 6 | 1,7348 | 47,2 | 81,8826 | 3,0095 | 2227,84 | 60,0 | -5,7 | 32,49 | 10,5 |
| 7 | 1,6928 | 55,2 | 93,4426 | 2,8656 | 3047,04 | 57,5 | -8,2 | 67,24 | 16,6 |
| Total | 12,3234 | 384,3 | 675,9974 | 21,7078 | 21338,41 | 403,4 | -1,8 | 200,78 | 56,3 |
| Wed zn. | 1,7605 | 54,9 | 96,5711 | 3,1011 | 3048,34 | X | X | 28,68 | 8,0 |
| σ | 0,0425 | 5,86 | X | X | X | X | X | X | X |
| σ2 | 0,0018 | 34,339 | X | X | X | X | X | X | X |
The values of the regression parameters A and IN amounted to:
A=Y -B x = 1.7605+0.0023 54.9 = 1.887
A linear equation is obtained: Y=1.887-0.0023x. We potentiate the resulting equation and write it in the usual form:
y x =10 1.887 10 -0.0023x = 77.1 0.9947 x
We estimate the tightness of the relationship through the correlation index p xy: 
1. For the first time the term "regression" was introduced by the founder of biometrics F. Galton (XIX century), whose ideas were developed by his follower K. Pearson.
Regression analysis- a method of statistical data processing that allows you to measure the relationship between one or more causes (factorial signs) and a consequence (effective sign).
sign- this is the main distinguishing feature, feature of the phenomenon or process being studied.
Effective sign - investigated indicator.
Factor sign- an indicator that affects the value of the effective feature.
The purpose of the regression analysis is to evaluate the functional dependence of the average value of the effective feature ( at) from factorial ( x 1, x 2, ..., x n), expressed as regression equations
at= f(x 1, x 2, ..., x n). (6.1)
There are two types of regression: paired and multiple.
Paired (simple) regression- equation of the form:
at= f(x). (6.2)
The resultant feature in pairwise regression is considered as a function of one argument, i.e. one factor.
Regression analysis includes the following steps:
definition of the function type;
determination of regression coefficients;
Calculation of theoretical values of the effective feature;
Checking the statistical significance of the regression coefficients;
Checking the statistical significance of the regression equation.
Multiple regression- equation of the form:
at= f(x 1, x 2, ..., x n). (6.3)
The resultant feature is considered as a function of several arguments, i.e. many factors.
2. In order to correctly determine the type of function, it is necessary to find the direction of the connection based on theoretical data.
According to the direction of the connection, the regression is divided into:
· direct regression, arising under the condition that with an increase or decrease in the independent value " X" values of the dependent quantity " at" also increase or decrease accordingly;
· reverse regression, arising under the condition that with an increase or decrease in the independent value "X" dependent value " at" decreases or increases accordingly.
To characterize the relationships, the following types of paired regression equations are used:
· y=a+bx– linear;
· y=e ax + b – exponential;
· y=a+b/x – hyperbolic;
· y=a+b 1 x+b 2 x 2 – parabolic;
· y=ab x – exponential and etc.
Where a, b 1 , b 2- coefficients (parameters) of the equation; at- effective sign; X- factor sign.
3. The construction of the regression equation is reduced to estimating its coefficients (parameters), for this they use least square method(MNK).
The least squares method allows you to obtain such estimates of the parameters, in which the sum of the squared deviations of the actual values of the effective feature " at»from theoretical « y x» is minimal, that is
Regression Equation Options y=a+bx by the least squares method are estimated using the formulas:
Where A - free coefficient, b- regression coefficient, shows how much the resultant sign will change y» when changing the factor attribute « x» per unit of measure.
4. To assess the statistical significance of the regression coefficients, Student's t-test is used.
Scheme for checking the significance of regression coefficients:
1) H 0: a=0, b=0 - regression coefficients are insignificantly different from zero.
H 1: a≠ 0, b≠ 0 - regression coefficients are significantly different from zero.
2) R=0.05 – significance level.
Where m b,m a- random errors:
 ;
;  . (6.7)
4) t table(R; f),
Where f=n-k- 1 - number of degrees of freedom (table value), n- number of observations, k X".
5) If , then deviates, i.e. significant coefficient.
If , then is accepted, i.e. coefficient is insignificant.
5. To check the correctness of the constructed regression equation, the Fisher criterion is used.
Scheme for checking the significance of the regression equation:
1) H 0: the regression equation is not significant.
H 1: the regression equation is significant.
2) R=0.05 – significance level.
3)  , (6.8)
where is the number of observations; k- the number of parameters in the equation with variables " X"; at- the actual value of the effective feature; y x- the theoretical value of the effective feature; - coefficient of pair correlation.
4) F table(R; f 1 ; f2),
Where f 1 \u003d k, f 2 \u003d n-k-1- number of degrees of freedom (table values).
5) If F calc >F table, then the regression equation is chosen correctly and can be applied in practice.
If F calc
6. The main indicator reflecting the measure of the quality of regression analysis is coefficient of determination (R 2).
Determination coefficient shows what proportion of the dependent variable " at» is taken into account in the analysis and is caused by the influence of the factors included in the analysis.
Determination coefficient (R2) takes values in the range . The regression equation is qualitative if R2 ≥0,8.
The determination coefficient is equal to the square of the correlation coefficient, i.e.
Example 6.1. Based on the following data, construct and analyze the regression equation:
Solution.
1) Calculate the correlation coefficient: . The relationship between the signs is direct and moderate.
2) Build a paired linear regression equation.
2.1) Make a calculation table.
| № | X | at | Hu | x 2 | y x | (y-y x) 2 | ||
| 55,89 | 47,54 | 65,70 | ||||||
| 45,07 | 15,42 | 222,83 | ||||||
| 54,85 | 34,19 | 8,11 | ||||||
| 51,36 | 5,55 | 11,27 | ||||||
| 42,28 | 45,16 | 13,84 | ||||||
| 47,69 | 1,71 | 44,77 | ||||||
| 45,86 | 9,87 | 192,05 | ||||||
| Sum | 159,45 | 558,55 | ||||||
| Average | 77519,6 | 22,78 | 79,79 | 2990,6 |
![]() ,
,
Paired linear regression equation: y x \u003d 25.17 + 0.087x.
3) Find theoretical values " y x» by substituting actual values into the regression equation « X».
4) Plot graphs of actual " at" and theoretical values " y x» effective feature (Figure 6.1): r xy =0.47) and a small number of observations.
7) Calculate the coefficient of determination: R2=(0.47) 2 =0.22. The constructed equation is of poor quality.
Because calculations during regression analysis are quite voluminous, it is recommended to use special programs ("Statistica 10", SPSS, etc.).
Figure 6.2 shows a table with the results of the regression analysis carried out using the program "Statistica 10".

Figure 6.2. The results of the regression analysis carried out using the program "Statistica 10"
5. Literature:
1. Gmurman V.E. Probability Theory and Mathematical Statistics: Proc. manual for universities / V.E. Gmurman. - M.: Higher school, 2003. - 479 p.
2. Koichubekov B.K. Biostatistics: Textbook. - Almaty: Evero, 2014. - 154 p.
3. Lobotskaya N.L. Higher Mathematics. / N.L. Lobotskaya, Yu.V. Morozov, A.A. Dunaev. - Minsk: Higher School, 1987. - 319 p.
4. Medic V.A., Tokmachev M.S., Fishman B.B. Statistics in Medicine and Biology: A Guide. In 2 volumes / Ed. Yu.M. Komarov. T. 1. Theoretical statistics. - M.: Medicine, 2000. - 412 p.
5. Application of statistical analysis methods for the study of public health and health care: textbook / ed. Kucherenko V.Z. - 4th ed., revised. and additional - M.: GEOTAR - Media, 2011. - 256 p.
After correlation analysis has revealed the presence of statistical relationships between variables and assessed the degree of their closeness, they usually proceed to the mathematical description of a specific type of dependency using regression analysis. For this purpose, a class of functions is selected that relates the effective indicator y and the arguments x 1, x 2, ..., x to the most informative arguments are selected, estimates of unknown values of the parameters of the link equation are calculated and the properties of the resulting equation are analyzed.
The function f (x 1, x 2, ..., x k) describing the dependence of the average value of the effective feature y on the given values of the arguments is called the regression function (equation). The term "regression" (lat. - regression - retreat, return to something) was introduced by the English psychologist and anthropologist F. Galton and is associated exclusively with the specifics of one of the first concrete examples in which this concept was used. So, processing statistical data in connection with the analysis of the heredity of growth, F. Galton found that if fathers deviate from the average height of all fathers by x inches, then their sons deviate from the average height of all sons by less than x inches. The revealed trend was called "regression to the mean state". Since then, the term "regression" has been widely used in the statistical literature, although in many cases it does not accurately characterize the concept of statistical dependence.
For an accurate description of the regression equation, it is necessary to know the law of distribution of the effective indicator y. In statistical practice, it is usually necessary to limit oneself to the search for suitable approximations for the unknown true regression function, since the researcher does not have exact knowledge of the conditional law of the probability distribution of the analyzed result indicator y for given values of the argument x.
Consider the relationship between true f(x) = M(y1x), model regression? and the y score of the regression. Let the effective indicator y be related to the argument x by the ratio:
where is a random variable having normal law distributions, with Me = 0 and D e = y 2 . The true regression function in this case is: f(x) = M(y/x) = 2x 1.5.
Suppose that we do not know the exact form of the true regression equation, but we have nine observations on a two-dimensional random variable related by the ratio yi = 2x1.5 + e, and shown in Fig. 1
Figure 1 - Mutual arrangement of truth f (x) and theoretical? regression models
Location of points in fig. 1 allows you to limit yourself to the class of linear dependencies of the form? = at 0 + at 1 x. Using the least squares method, we find an estimate of the regression equation y = b 0 +b 1 x. For comparison, in Fig. 1 shows graphs of the true regression function y \u003d 2x 1.5, the theoretical approximating regression function? = at 0 + at 1 x .
Since we made a mistake in choosing the class of the regression function, and this is quite common in the practice of statistical research, our statistical conclusions and estimates will turn out to be erroneous. And no matter how much we increase the volume of observations, our sample estimate of y will not be close to the true regression function f(x). If we correctly chose the class of regression functions, then the inaccuracy in the description of f (x) using? could only be explained by the limited sample size.
In order to best restore the conditional value of the effective indicator y(x) and the unknown regression function f(x) = M(y/x) from the initial statistical data, the following adequacy criteria (loss functions) are most often used.
Least square method. According to it, the squared deviation of the observed values of the effective indicator y, (i = 1,2,..., n) from the model values, is minimized. = f(x i), where x i is the value of the vector of arguments in the i-th observation:
Method of least modules. According to it, the sum of absolute deviations of the observed values of the effective indicator from the modular values is minimized. And we get = f(x i), mean absolute median regression? |y i - f(х i)| >min.
Regression analysis is a method of statistical analysis of the dependence of a random variable y on variables x j = (j = 1,2, ..., k), considered in regression analysis as not random variables, regardless of the true distribution law x j.
It is usually assumed that the random variable y has a normal distribution law with a conditional mathematical expectation y, which is a function of the arguments x/ (/ = 1, 2, ..., k) and a constant, independent of the arguments, variance y 2 .
In general, the linear model of regression analysis has the form:
Y = Y k j=0 V j c j(x 1 , x 2 . . .. ,x k)+E
where c j is some function of its variables - x 1 , x 2 . . .. ,x k , E is a random variable with zero mathematical expectation and variance y 2 .
In regression analysis, the type of regression equation is chosen based on the physical nature of the phenomenon under study and the results of observation.
Estimates of unknown parameters of the regression equation are usually found by the least squares method. Below we will dwell on this problem in more detail.
Two-dimensional linear regression equation. Let, based on the analysis of the phenomenon under study, it is assumed that in the "average" y has linear function from x, i.e. there is a regression equation
y \u003d M (y / x) \u003d at 0 + at 1 x)
where M(y1x) is the conditional mathematical expectation of a random variable y for a given x; at 0 and at 1 - unknown parameters of the general population, which should be estimated from the results of sample observations.
Suppose that to estimate the parameters at 0 and at 1, a sample of size n is taken from a two-dimensional general population (x, y), where (x, y,) is the result of the i-th observation (i = 1, 2,..., n) . In this case, the regression analysis model has the form:
y j = at 0 + at 1 x+e j .
where e j .- independent normally distributed random variables with zero mathematical expectation and variance y 2 , i.e. M e j . = 0;
D e j .= y 2 for all i = 1, 2,..., n.
According to the least squares method, as estimates of the unknown parameters at 0 and at 1, one should take such values of the sample characteristics b 0 and b 1 that minimize the sum of the squared deviations of the values of the effective feature y i from the conditional mathematical expectation? i
We will consider the methodology for determining the influence of marketing characteristics on the profit of an enterprise using the example of seventeen typical enterprises with average sizes and indicators of economic activity.
When solving the problem, the following characteristics were taken into account, identified as the most significant (important) as a result of a questionnaire survey:
* innovative activity of the enterprise;
* planning the range of products;
* formation of pricing policy;
* public relations;
* marketing system;
* employee incentive system.
Based on the system of comparisons by factors, square adjacency matrices were constructed, in which the values of relative priorities for each factor were calculated: innovative activity of the enterprise, planning of the product range, pricing policy, advertising, public relations, sales system, employee incentive system.
Estimates of priorities for the factor "relationships with the public" were obtained as a result of a survey of the company's specialists. The following designations are accepted: > (better), > (better or the same), = (equal),< (хуже или одинаково), <
Next, the problem of a comprehensive assessment of the level of marketing of the enterprise was solved. When calculating the indicator, the significance (weight) of the considered particular features was determined and the problem of linear convolution of particular indicators was solved. Data processing was carried out according to specially developed programs.
Next, a comprehensive assessment of the level of marketing of the enterprise is calculated - the marketing coefficient, which is entered in table 1. In addition, the above table includes indicators characterizing the enterprise as a whole. The data in the table will be used for regression analysis. The result is profit. Along with the marketing coefficient, the following indicators were used as factor signs: the volume of gross output, the cost of fixed assets, the number of employees, the coefficient of specialization.
Table 1 - Initial data for regression analysis

Based on the data in the table and on the basis of factors with the most significant values of the correlation coefficients, regression functions of the dependence of profit on factors were built.
The regression equation in our case will take the form:
The coefficients of the regression equation speak about the quantitative influence of the factors discussed above on the amount of profit. They show how many thousand rubles its value changes when the factor sign changes by one unit. As follows from the equation, an increase in the marketing mix ratio by one unit gives an increase in profit by 1547.7 thousand rubles. This suggests that there is a huge potential for improving the economic performance of enterprises in improving marketing activities.
In the study of marketing effectiveness, the most interesting and most important factor feature is the X5 factor - the marketing coefficient. In accordance with the theory of statistics, the advantage of the existing multiple regression equation is the ability to evaluate the isolated influence of each factor, including the marketing factor.
The results of the regression analysis carried out are also more widely used than for calculating the parameters of the equation. The criterion for classifying (Kef,) enterprises as relatively better or relatively worse is based on the relative indicator of the result:

where Y facti is the actual value of the i-th enterprise, thousand rubles;
Y calculated - the value of the profit of the i-th enterprise, obtained by calculation according to the regression equation
In terms of the problem being solved, the value is called the "efficiency factor". The activity of the enterprise can be considered effective in cases where the value of the coefficient is greater than one. This means that the actual profit is greater than the profit averaged over the sample.
The actual and calculated profit values are presented in Table. 2.
Table 2 - Analysis of the effective feature in the regression model

Analysis of the table shows that in our case, the activities of enterprises 3, 5, 7, 9, 12, 14, 15, 17 for the period under review can be considered successful.
The main feature of regression analysis is that it can be used to obtain specific information about the form and nature of the relationship between the variables under study.
The sequence of stages of regression analysis
Let us briefly consider the stages of regression analysis.
Task formulation. At this stage, preliminary hypotheses about the dependence of the studied phenomena are formed.
Definition of dependent and independent (explanatory) variables.
Collection of statistical data. Data must be collected for each of the variables included in the regression model.
Formulation of a hypothesis about the form of connection (simple or multiple, linear or non-linear).
Definition regression functions (consists in the calculation of the numerical values of the parameters of the regression equation)
Evaluation of the accuracy of regression analysis.
Interpretation of the obtained results. The results of the regression analysis are compared with preliminary hypotheses. The correctness and plausibility of the obtained results are evaluated.
Prediction of unknown values of the dependent variable.
With the help of regression analysis, it is possible to solve the problem of forecasting and classification. Predictive values are calculated by substituting the values of the explanatory variables into the regression equation. The classification problem is solved in this way: the regression line divides the entire set of objects into two classes, and the part of the set where the value of the function is greater than zero belongs to one class, and the part where it is less than zero belongs to another class.
Tasks of regression analysis
Consider the main tasks of regression analysis: establishing the form of dependence, determining regression functions, an estimate of the unknown values of the dependent variable.
Establishing the form of dependence.
The nature and form of the relationship between variables can form the following types of regression:
positive linear regression (expressed as a uniform growth of the function);
positive uniformly accelerating regression;
positive uniformly increasing regression;
negative linear regression (expressed as a uniform drop in function);
negative uniformly accelerated decreasing regression;
negative uniformly decreasing regression.
However, the varieties described are usually not found in pure form, but in combination with each other. In this case, one speaks of combined forms of regression.
Definition of the regression function.
The second task is to find out the effect on the dependent variable of the main factors or causes, all other things being equal, and subject to the exclusion of the impact on the dependent variable of random elements. regression function defined as a mathematical equation of one type or another.
Estimation of unknown values of the dependent variable.
The solution of this problem is reduced to solving a problem of one of the following types:
Estimation of the values of the dependent variable within the considered interval of the initial data, i.e. missing values; this solves the problem of interpolation.
Estimating the future values of the dependent variable, i.e. finding values outside the given interval of the initial data; this solves the problem of extrapolation.
Both problems are solved by substituting the found estimates of the parameters of the values of the independent variables into the regression equation. The result of solving the equation is an estimate of the value of the target (dependent) variable.
Let's look at some of the assumptions that regression analysis relies on.
Linearity assumption, i.e. it is assumed that the relationship between the variables under consideration is linear. So, in this example, we built a scatterplot and were able to see a clear linear relationship. If, on the scatterplot of variables, we see a clear absence of a linear relationship, i.e. there is a non-linear relationship, non-linear methods of analysis should be used.
Normality Assumption leftovers. It assumes that the distribution of the difference between predicted and observed values is normal. To visually determine the nature of the distribution, you can use histograms leftovers.
When using regression analysis, one should take into account its main limitation. It consists in the fact that regression analysis allows you to detect only dependencies, and not the relationships that underlie these dependencies.
Regression analysis makes it possible to assess the degree of association between variables by calculating the expected value of a variable based on several known values.
Regression equation.
The regression equation looks like this: Y=a+b*X
Using this equation, the variable Y is expressed in terms of the constant a and the slope of the line (or slope) b multiplied by the value of the variable X. The constant a is also called the intercept, and the slope is the regression coefficient or B-factor.
In most cases (if not always) there is a certain scatter of observations about the regression line.
Remainder is the deviation of an individual point (observation) from the regression line (predicted value).
To solve the problem of regression analysis in MS Excel, select from the menu Service"Analysis Package" and the Regression analysis tool. Specify the X and Y input intervals. The Y input interval is the range of dependent data being analyzed and must include one column. The input interval X is the range of independent data to be analyzed. The number of input ranges must not exceed 16.
At the output of the procedure in the output range, we get the report given in table 8.3a-8.3v.
RESULTS
|
Table 8.3a. Regression statistics |
|
|
Regression statistics |
|
|
Multiple R | |
|
R-square | |
|
Normalized R-square | |
|
standard error | |
|
Observations | |
First, consider the upper part of the calculations presented in table 8.3a, - regression statistics.
Value R-square, also called the measure of certainty, characterizes the quality of the resulting regression line. This quality is expressed by the degree of correspondence between the original data and the regression model (calculated data). The measure of certainty is always within the interval .
In most cases, the value R-square is between these values, called extreme, i.e. between zero and one.
If the value R-square close to unity, this means that the constructed model explains almost all the variability of the corresponding variables. Conversely, the value R-square, close to zero, means poor quality of the constructed model.
In our example, the measure of certainty is 0.99673, which indicates a very good fit of the regression line to the original data.
plural R - coefficient of multiple correlation R - expresses the degree of dependence of independent variables (X) and dependent variable (Y).
Multiple R equal to the square root of the coefficient of determination, this value takes values in the range from zero to one.
In simple linear regression analysis plural R equal to the Pearson correlation coefficient. Really, plural R in our case, it is equal to the Pearson correlation coefficient from the previous example (0.998364).
|
Table 8.3b. Regression coefficients |
|||
|
Odds |
standard error |
t-statistic |
|
|
Y-intersection | |||
|
Variable X 1 | |||
|
* A truncated version of the calculations is given |
|||
Now consider the middle part of the calculations presented in table 8.3b. Here, the regression coefficient b (2.305454545) and the offset along the y-axis are given, i.e. constant a (2.694545455).
Based on the calculations, we can write the regression equation as follows:
Y= x*2.305454545+2.694545455
The direction of the relationship between the variables is determined based on the signs (negative or positive) of the regression coefficients (coefficient b).
If the sign of the regression coefficient is positive, the relationship between the dependent variable and the independent variable will be positive. In our case, the sign of the regression coefficient is positive, therefore, the relationship is also positive.
If the sign of the regression coefficient is negative, the relationship between the dependent variable and the independent variable is negative (inverse).
IN table 8.3c. output results are presented leftovers. In order for these results to appear in the report, it is necessary to activate the "Residuals" checkbox when launching the "Regression" tool.
REMAINING WITHDRAWAL
|
Table 8.3c. Remains |
|||
|
Observation |
Predicted Y |
Remains |
Standard balances |
Using this part of the report, we can see the deviations of each point from the constructed regression line. Greatest absolute value remainder in our case - 0.778, the smallest - 0.043. For a better interpretation of these data, we will use the plot of the original data and the constructed regression line presented in Fig. rice. 8.3. As you can see, the regression line is quite accurately "fitted" to the values of the original data.
It should be taken into account that the example under consideration is quite simple and it is far from always possible to qualitatively construct a linear regression line.
Rice. 8.3. Initial data and regression line
The problem of estimating unknown future values of the dependent variable based on the known values of the independent variable remained unconsidered, i.e. forecasting task.
Having a regression equation, the forecasting problem is reduced to solving the equation Y= x*2.305454545+2.694545455 with known values of x. The results of predicting the dependent variable Y six steps ahead are presented in table 8.4.
|
Table 8.4. Y variable prediction results |
|
|
Y(predicted) |
|
Thus, as a result of using regression analysis in the Microsoft Excel package, we:
built a regression equation;
established the form of dependence and the direction of the relationship between the variables - a positive linear regression, which is expressed in a uniform growth of the function;
established the direction of the relationship between the variables;
assessed the quality of the resulting regression line;
were able to see the deviations of the calculated data from the data of the original set;
predicted the future values of the dependent variable.
If regression function is defined, interpreted and justified, and the assessment of the accuracy of the regression analysis meets the requirements, we can assume that the constructed model and predictive values are sufficiently reliable.
The predicted values obtained in this way are the average values that can be expected.
In this paper, we reviewed the main characteristics descriptive statistics and among them such concepts as average value,median,maximum,minimum and other characteristics of data variation.
There was also a brief discussion of the concept emissions. The considered characteristics refer to the so-called exploratory data analysis, its conclusions may not apply to the general population, but only to a data sample. Exploratory data analysis is used to draw primary conclusions and form hypotheses about the population.
The basics of correlation and regression analysis, their tasks and possibilities of practical use were also considered.